
Search for Indicators
Behavioral Health
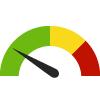
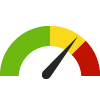
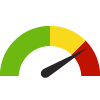
Indicator Gauge Icon Legend
Legend Colors
Red is bad, green is good, blue is not statistically different/neutral.
Compared to Distribution
 the value is in the best half of communities.
 the value is in the 2nd worst quarter of communities.
 the value is in the worst quarter of communities.
Compared to Target
 meets target;
  does not meet target.
Compared to a Single Value
 lower than the comparison value;
 higher than the comparison value;
 not statistically different from comparison value.
Trend

 non-significant change over time;
 significant change over time;
  no change over time.
Compared to Prior Value
 higher than the previous measurement period;
 lower than the previous measurement period;
 no statistically different change from previous measurement period.
Parish: East Baton Rouge
Value
Compared to:
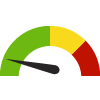
Parish: East Baton Rouge Adults who Drink Excessively
Parish: East Baton Rouge Adults who Drink Excessively
17.6%
(2021)
Compared to:
LA Parishes
The distribution is based on data from 64 Louisiana Parishes.
U.S. Counties
The distribution is based on data from 3,141 U.S. counties and county equivalents.
LA Value
(20.0%)
The regional value is compared to the Louisiana State value.
US Value
(18.1%)
The regional value is compared to the national value.
Prior Value
(22.0%)
Prior Value compares a measured value with the previously measured value. Confidence intervals were taken into account in determining the direction of the comparison.
Trend
This comparison measures the indicator’s values over multiple time periods.<br>The Mann-Kendall Test for Statistical Significance is used to evaluate the trend<br>over 4 to 10 periods of measure, subject to data availability and comparability.
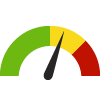
Parish: East Baton Rouge Adults who Smoke
Parish: East Baton Rouge Adults who Smoke
17.3%
(2021)
Compared to:

LA Parishes
The distribution is based on data from 64 Louisiana Parishes.
U.S. Counties
The distribution is based on data from 3,074 U.S. counties and county equivalents.
US Value
(13.5%)
The regional value is compared to the national value.
HP 2030 Target
(6.1%)
<div>TU-02: Reduce current cigarette smoking in adults <strong>(LEADING HEALTH INDICATOR)</strong></div>
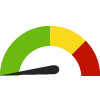
Parish: East Baton Rouge Age-Adjusted Death Rate due to Suicide
Parish: East Baton Rouge Age-Adjusted Death Rate due to Suicide
12.1
Deaths per 100,000 population
(2018-2020)
Compared to:

LA Parishes
The distribution is based on data from 27 Louisiana Parishes.
U.S. Counties
The distribution is based on data from 1,307 U.S. counties and county equivalents.
LA Value
(14.6)
The regional value is compared to the Louisiana State value.
US Value
(13.9)
The regional value is compared to the national value.
Prior Value
(13.2)
Prior Value compares a measured value with the previously measured value. Confidence intervals were taken into account in determining the direction of the comparison.
Trend
This comparison measures the indicator’s values over multiple time periods.<br>The Mann-Kendall Test for Statistical Significance is used to evaluate the trend<br>over 4 to 10 periods of measure, subject to data availability and comparability.
HP 2030 Target
(12.8)
<div>MHMD-01: Reduce the suicide rate <strong>(LEADING HEALTH INDICATOR)</strong></div>
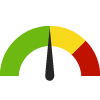
Parish: East Baton Rouge Alcohol-Impaired Driving Deaths
Parish: East Baton Rouge Alcohol-Impaired Driving Deaths
32.6%
Percent of driving deaths with alcohol involvement
(2017-2021)
Compared to:

LA Parishes
The distribution is based on data from 64 Louisiana Parishes.
U.S. Counties
The distribution is based on data from 3,116 U.S. counties and county equivalents.
LA Value
(31.2%)
The regional value is compared to the Louisiana State value.
US Value
(26.3%)
The regional value is compared to the national value.
Prior Value
(32.8%)
Prior Value compares a measured value with the previously measured value. Confidence intervals were taken into account in determining the direction of the comparison.
Trend
This comparison measures the indicator’s values over multiple time periods.<br>The Mann-Kendall Test for Statistical Significance is used to evaluate the trend<br>over 4 to 10 periods of measure, subject to data availability and comparability.
Parish: East Baton Rouge Death Rate due to Drug Poisoning
Parish: East Baton Rouge Death Rate due to Drug Poisoning
46.1
Deaths per 100,000 population
(2019-2021)
Compared to:

LA Parishes
The distribution is based on data from 50 Louisiana Parishes.
U.S. Counties
The distribution is based on data from 1,899 U.S. counties and county equivalents.
LA Value
(40.4)
The regional value is compared to the Louisiana State value.
US Value
(27.2)
The regional value is compared to the national value.
HP 2030 Target
(20.7)
<div>SU-03: Reduce drug overdose deaths <strong>(LEADING HEALTH INDICATOR)</strong></div>
Parish: East Baton Rouge Depression: Medicare Population
Parish: East Baton Rouge Depression: Medicare Population
18.0%
(2022)
Compared to:

LA Parishes
The distribution is based on data from 64 Louisiana Parishes.
U.S. Counties
The distribution is based on data from 3,129 U.S. counties and county equivalents.
LA Value
(17.0%)
The regional value is compared to the Louisiana State value.
US Value
(16.0%)
The regional value is compared to the national value.
Prior Value
(17.0%)
Prior Value compares a measured value with the previously measured value. Confidence intervals were not taken into account in determining the direction of the comparison.
Trend
This comparison measures the indicator’s values over multiple time periods.<br>The Mann-Kendall Test for Statistical Significance is used to evaluate the trend<br>over 4 to 10 periods of measure, subject to data availability and comparability.
Parish: East Baton Rouge Frequent Mental Distress
Parish: East Baton Rouge Frequent Mental Distress
15.9%
(2019)
Compared to:
LA Parishes
The distribution is based on data from 64 Louisiana Parishes.
U.S. Counties
The distribution is based on data from 3,121 U.S. counties and county equivalents.
LA Value
(18.9%)
The regional value is compared to the Louisiana State value.
US Value
(14.0%)
The regional value is compared to the national value.
Prior Value
(15.0%)
Prior Value compares a measured value with the previously measured value. Confidence intervals were taken into account in determining the direction of the comparison.
Parish: East Baton Rouge Health Behaviors Ranking
Parish: East Baton Rouge Health Behaviors Ranking
5
(2023)
Compared to:
LA Parishes
The distribution is based on data from 64 Louisiana Parishes.
Parish: East Baton Rouge Mothers who Smoked During Pregnancy
Parish: East Baton Rouge Mothers who Smoked During Pregnancy
2.4%
(2021)
Compared to:
LA Parishes
The distribution is based on data from 59 Louisiana Parishes.
LA Value
(6.0%)
The regional value is compared to the Louisiana State value.
US Value
(4.6%)
The regional value is compared to the national value. The source for the national value is Centers for Disease Control and Prevention
Prior Value
(2.4%)
Prior Value compares a measured value with the previously measured value. Confidence intervals were not taken into account in determining the direction of the comparison.
Trend
This comparison measures the indicator’s values over multiple time periods.<br>The Mann-Kendall Test for Statistical Significance is used to evaluate the trend<br>over 4 to 10 periods of measure, subject to data availability and comparability.
HP 2030 Target
(4.3%)
Parish: East Baton Rouge Persons with a Cognitive Difficulty
Parish: East Baton Rouge Persons with a Cognitive Difficulty
5.7%
(2018-2022)
Compared to:


LA Value
(6.6%)
The regional value is compared to the Louisiana State value.
US Value
(5.3%)
The regional value is compared to the national value.
Trend
This comparison measures the indicator’s values over multiple time periods.<br>The Mann-Kendall Test for Statistical Significance is used to evaluate the trend<br>over 4 to 10 periods of measure, subject to data availability and comparability.
