
Search for Indicators
Priority: Healthy Living
Healthy living is having the opportunity, capability and motivation to act in a way that positively affects your physical and mental well-being. Paying attention to what you eat, being physically active, and learning more about your food and yourself can help you meet your health goals. You can click the links below to look at different data sets on brcitykey.com
Indicator Gauge Icon Legend
Legend Colors
Red is bad, green is good, blue is not statistically different/neutral.
Compared to Distribution
 the value is in the best half of communities.
 the value is in the 2nd worst quarter of communities.
 the value is in the worst quarter of communities.
Compared to Target
 meets target;
  does not meet target.
Compared to a Single Value
 lower than the comparison value;
 higher than the comparison value;
 not statistically different from comparison value.
Trend

 non-significant change over time;
 significant change over time;
  no change over time.
Compared to Prior Value
 higher than the previous measurement period;
 lower than the previous measurement period;
 no statistically different change from previous measurement period.
Health / Cancer
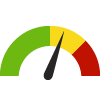
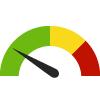
Mammography Screening: Medicare Population Parish: East Baton Rouge
Mammography Screening: Medicare Population Parish: East Baton Rouge
48.0%
(2022)
Compared to:
LA Parishes
The distribution is based on data from 64 Louisiana Parishes.
Health / County Health Rankings
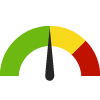
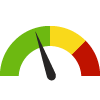
Physical Environment Ranking Parish: East Baton Rouge
Physical Environment Ranking Parish: East Baton Rouge
32
(2023)
Compared to:
LA Parishes
The distribution is based on data from 64 Louisiana Parishes.
Health / Health Care Access & Quality
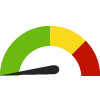
Non-Physician Primary Care Provider Rate Parish: East Baton Rouge
Non-Physician Primary Care Provider Rate Parish: East Baton Rouge
222
Providers per 100,000 population
(2023)
Compared to:
LA Parishes
The distribution is based on data from 64 Louisiana Parishes.
Health / Mortality Data
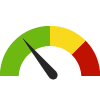
Life Expectancy Parish: East Baton Rouge
Life Expectancy Parish: East Baton Rouge
73.9
Years
(2019-2021)
Compared to:
LA Parishes
The distribution is based on data from 64 Louisiana Parishes.
Health / Wellness & Lifestyle
Poor Physical Health: 14+ Days Parish: East Baton Rouge
Poor Physical Health: 14+ Days Parish: East Baton Rouge
11.9%
(2021)
Compared to:
LA Parishes
The distribution is based on data from 64 Louisiana Parishes.
Poor Physical Health: 14+ Days Neighborhood: Baker
Poor Physical Health: 14+ Days Neighborhood: Baker
13.4%
(2021)
Compared to:
LA Parishes
The distribution is based on data from 64 Louisiana Parishes.
Poor Physical Health: 14+ Days Neighborhood: Bocage/Citiplace/Concord Estates
Poor Physical Health: 14+ Days Neighborhood: Bocage/Citiplace/Concord Estates
8.8%
(2021)
Compared to:
LA Parishes
The distribution is based on data from 64 Louisiana Parishes.
Poor Physical Health: 14+ Days Neighborhood: Broadmoor
Poor Physical Health: 14+ Days Neighborhood: Broadmoor
11.2%
(2021)
Compared to:
LA Parishes
The distribution is based on data from 64 Louisiana Parishes.
Poor Physical Health: 14+ Days Neighborhood: Brookstown
Poor Physical Health: 14+ Days Neighborhood: Brookstown
20.8%
(2021)
Compared to:

LA Parishes
The distribution is based on data from 64 Louisiana Parishes.
Poor Physical Health: 14+ Days Neighborhood: Brownsfield
Poor Physical Health: 14+ Days Neighborhood: Brownsfield
13.0%
(2021)
Compared to:
LA Parishes
The distribution is based on data from 64 Louisiana Parishes.
Poor Physical Health: 14+ Days Neighborhood: Central
Poor Physical Health: 14+ Days Neighborhood: Central
11.3%
(2021)
Compared to:
LA Parishes
The distribution is based on data from 64 Louisiana Parishes.
Poor Physical Health: 14+ Days Neighborhood: City Park
Poor Physical Health: 14+ Days Neighborhood: City Park
7.7%
(2021)
Compared to:
LA Parishes
The distribution is based on data from 64 Louisiana Parishes.
Poor Physical Health: 14+ Days Neighborhood: College Town
Poor Physical Health: 14+ Days Neighborhood: College Town
8.9%
(2021)
Compared to:
LA Parishes
The distribution is based on data from 64 Louisiana Parishes.
Poor Physical Health: 14+ Days Neighborhood: Cortana/Villa del Rey
Poor Physical Health: 14+ Days Neighborhood: Cortana/Villa del Rey
11.8%
(2021)
Compared to:
LA Parishes
The distribution is based on data from 64 Louisiana Parishes.
Poor Physical Health: 14+ Days Neighborhood: Delmont Place
Poor Physical Health: 14+ Days Neighborhood: Delmont Place
19.9%
(2021)
Compared to:
LA Parishes
The distribution is based on data from 64 Louisiana Parishes.
Poor Physical Health: 14+ Days Neighborhood: Downtown
Poor Physical Health: 14+ Days Neighborhood: Downtown
15.1%
(2021)
Compared to:
LA Parishes
The distribution is based on data from 64 Louisiana Parishes.
Poor Physical Health: 14+ Days Neighborhood: Downtown East
Poor Physical Health: 14+ Days Neighborhood: Downtown East
20.7%
(2021)
Compared to:
LA Parishes
The distribution is based on data from 64 Louisiana Parishes.
Poor Physical Health: 14+ Days Neighborhood: East Fairfields/Melrose Place
Poor Physical Health: 14+ Days Neighborhood: East Fairfields/Melrose Place
14.4%
(2021)
Compared to:
LA Parishes
The distribution is based on data from 64 Louisiana Parishes.
Poor Physical Health: 14+ Days Neighborhood: Eden Park
Poor Physical Health: 14+ Days Neighborhood: Eden Park
19.3%
(2021)
Compared to:
LA Parishes
The distribution is based on data from 64 Louisiana Parishes.
Poor Physical Health: 14+ Days Neighborhood: Fairfields
Poor Physical Health: 14+ Days Neighborhood: Fairfields
18.0%
(2021)
Compared to:
LA Parishes
The distribution is based on data from 64 Louisiana Parishes.
Poor Physical Health: 14+ Days Neighborhood: Fairwood
Poor Physical Health: 14+ Days Neighborhood: Fairwood
11.4%
(2021)
Compared to:
LA Parishes
The distribution is based on data from 64 Louisiana Parishes.
Poor Physical Health: 14+ Days Neighborhood: Forest Heights/Sunnybrook
Poor Physical Health: 14+ Days Neighborhood: Forest Heights/Sunnybrook
14.8%
(2021)
Compared to:
LA Parishes
The distribution is based on data from 64 Louisiana Parishes.
Poor Physical Health: 14+ Days Neighborhood: Glen Oaks/Zion City
Poor Physical Health: 14+ Days Neighborhood: Glen Oaks/Zion City
17.9%
(2021)
Compared to:
LA Parishes
The distribution is based on data from 64 Louisiana Parishes.
Poor Physical Health: 14+ Days Neighborhood: Goodwood
Poor Physical Health: 14+ Days Neighborhood: Goodwood
10.2%
(2021)
Compared to:
LA Parishes
The distribution is based on data from 64 Louisiana Parishes.
Poor Physical Health: 14+ Days Neighborhood: Goodwood Homesites
Poor Physical Health: 14+ Days Neighborhood: Goodwood Homesites
17.2%
(2021)
Compared to:

LA Parishes
The distribution is based on data from 64 Louisiana Parishes.
Poor Physical Health: 14+ Days Neighborhood: Istrouma/Dixie
Poor Physical Health: 14+ Days Neighborhood: Istrouma/Dixie
20.1%
(2021)
Compared to:
LA Parishes
The distribution is based on data from 64 Louisiana Parishes.
Poor Physical Health: 14+ Days Neighborhood: Jefferson Terrace/Inniswold
Poor Physical Health: 14+ Days Neighborhood: Jefferson Terrace/Inniswold
9.1%
(2021)
Compared to:
LA Parishes
The distribution is based on data from 64 Louisiana Parishes.
Poor Physical Health: 14+ Days Neighborhood: Jefferson/Drusilla
Poor Physical Health: 14+ Days Neighborhood: Jefferson/Drusilla
9.2%
(2021)
Compared to:
LA Parishes
The distribution is based on data from 64 Louisiana Parishes.
Poor Physical Health: 14+ Days Neighborhood: Jefferson/Tiger Bend
Poor Physical Health: 14+ Days Neighborhood: Jefferson/Tiger Bend
9.8%
(2021)
Compared to:
LA Parishes
The distribution is based on data from 64 Louisiana Parishes.
Poor Physical Health: 14+ Days Neighborhood: Jones Creek
Poor Physical Health: 14+ Days Neighborhood: Jones Creek
10.6%
(2021)
Compared to:
LA Parishes
The distribution is based on data from 64 Louisiana Parishes.
Poor Physical Health: 14+ Days Neighborhood: Kenilworth
Poor Physical Health: 14+ Days Neighborhood: Kenilworth
8.4%
(2021)
Compared to:
LA Parishes
The distribution is based on data from 64 Louisiana Parishes.
Poor Physical Health: 14+ Days Neighborhood: Kleinpeter
Poor Physical Health: 14+ Days Neighborhood: Kleinpeter
9.1%
(2021)
Compared to:
LA Parishes
The distribution is based on data from 64 Louisiana Parishes.
Poor Physical Health: 14+ Days Neighborhood: Legion Village
Poor Physical Health: 14+ Days Neighborhood: Legion Village
21.6%
(2021)
Compared to:
LA Parishes
The distribution is based on data from 64 Louisiana Parishes.
Poor Physical Health: 14+ Days Neighborhood: LSU
Poor Physical Health: 14+ Days Neighborhood: LSU
8.5%
(2021)
Compared to:
LA Parishes
The distribution is based on data from 64 Louisiana Parishes.
Poor Physical Health: 14+ Days Neighborhood: Mayfair
Poor Physical Health: 14+ Days Neighborhood: Mayfair
11.1%
(2021)
Compared to:
LA Parishes
The distribution is based on data from 64 Louisiana Parishes.
Poor Physical Health: 14+ Days Neighborhood: Mid City
Poor Physical Health: 14+ Days Neighborhood: Mid City
10.1%
(2021)
Compared to:
LA Parishes
The distribution is based on data from 64 Louisiana Parishes.
Poor Physical Health: 14+ Days Neighborhood: Millerville
Poor Physical Health: 14+ Days Neighborhood: Millerville
11.6%
(2021)
Compared to:
LA Parishes
The distribution is based on data from 64 Louisiana Parishes.
Poor Physical Health: 14+ Days Neighborhood: Monticello
Poor Physical Health: 14+ Days Neighborhood: Monticello
12.5%
(2021)
Compared to:
LA Parishes
The distribution is based on data from 64 Louisiana Parishes.
Poor Physical Health: 14+ Days Neighborhood: North Baton Rouge
Poor Physical Health: 14+ Days Neighborhood: North Baton Rouge
17.1%
(2021)
Compared to:
LA Parishes
The distribution is based on data from 64 Louisiana Parishes.
Poor Physical Health: 14+ Days Neighborhood: North Sherwood Forest
Poor Physical Health: 14+ Days Neighborhood: North Sherwood Forest
13.9%
(2021)
Compared to:
LA Parishes
The distribution is based on data from 64 Louisiana Parishes.
Poor Physical Health: 14+ Days Neighborhood: O'Neal
Poor Physical Health: 14+ Days Neighborhood: O'Neal
9.6%
(2021)
Compared to:
LA Parishes
The distribution is based on data from 64 Louisiana Parishes.
Poor Physical Health: 14+ Days Neighborhood: Old South Baton Rouge
Poor Physical Health: 14+ Days Neighborhood: Old South Baton Rouge
14.4%
(2021)
Compared to:
LA Parishes
The distribution is based on data from 64 Louisiana Parishes.
Poor Physical Health: 14+ Days Neighborhood: Park Forest/Oakcrest
Poor Physical Health: 14+ Days Neighborhood: Park Forest/Oakcrest
12.0%
(2021)
Compared to:
LA Parishes
The distribution is based on data from 64 Louisiana Parishes.
Poor Physical Health: 14+ Days Neighborhood: Perkins/Highland
Poor Physical Health: 14+ Days Neighborhood: Perkins/Highland
8.7%
(2021)
Compared to:
LA Parishes
The distribution is based on data from 64 Louisiana Parishes.
Poor Physical Health: 14+ Days Neighborhood: Pollard/Woodchase
Poor Physical Health: 14+ Days Neighborhood: Pollard/Woodchase
10.5%
(2021)
Compared to:
LA Parishes
The distribution is based on data from 64 Louisiana Parishes.
Poor Physical Health: 14+ Days Neighborhood: Port Hudson
Poor Physical Health: 14+ Days Neighborhood: Port Hudson
10.8%
(2021)
Compared to:
LA Parishes
The distribution is based on data from 64 Louisiana Parishes.
Poor Physical Health: 14+ Days Neighborhood: Pride/Chaneyville
Poor Physical Health: 14+ Days Neighborhood: Pride/Chaneyville
13.4%
(2021)
Compared to:
LA Parishes
The distribution is based on data from 64 Louisiana Parishes.
Poor Physical Health: 14+ Days Neighborhood: Scotlandville
Poor Physical Health: 14+ Days Neighborhood: Scotlandville
15.0%
(2021)
Compared to:
LA Parishes
The distribution is based on data from 64 Louisiana Parishes.
Poor Physical Health: 14+ Days Neighborhood: Shenandoah
Poor Physical Health: 14+ Days Neighborhood: Shenandoah
9.5%
(2021)
Compared to:
LA Parishes
The distribution is based on data from 64 Louisiana Parishes.
Poor Physical Health: 14+ Days Neighborhood: Sherwood Forest
Poor Physical Health: 14+ Days Neighborhood: Sherwood Forest
11.3%
(2021)
Compared to:
LA Parishes
The distribution is based on data from 64 Louisiana Parishes.
Poor Physical Health: 14+ Days Neighborhood: Smiley Heights/Melrose East
Poor Physical Health: 14+ Days Neighborhood: Smiley Heights/Melrose East
21.6%
(2021)
Compared to:
LA Parishes
The distribution is based on data from 64 Louisiana Parishes.
Poor Physical Health: 14+ Days Neighborhood: South Bluebonnet/Nicholson
Poor Physical Health: 14+ Days Neighborhood: South Bluebonnet/Nicholson
7.7%
(2021)
Compared to:
LA Parishes
The distribution is based on data from 64 Louisiana Parishes.
Poor Physical Health: 14+ Days Neighborhood: South Burbank
Poor Physical Health: 14+ Days Neighborhood: South Burbank
10.1%
(2021)
Compared to:
LA Parishes
The distribution is based on data from 64 Louisiana Parishes.
Poor Physical Health: 14+ Days Neighborhood: South Campus
Poor Physical Health: 14+ Days Neighborhood: South Campus
9.6%
(2021)
Compared to:
LA Parishes
The distribution is based on data from 64 Louisiana Parishes.
Poor Physical Health: 14+ Days Neighborhood: Southside
Poor Physical Health: 14+ Days Neighborhood: Southside
8.8%
(2021)
Compared to:
LA Parishes
The distribution is based on data from 64 Louisiana Parishes.
Poor Physical Health: 14+ Days Neighborhood: Stevendale
Poor Physical Health: 14+ Days Neighborhood: Stevendale
12.3%
(2021)
Compared to:
LA Parishes
The distribution is based on data from 64 Louisiana Parishes.
Poor Physical Health: 14+ Days Neighborhood: Tara
Poor Physical Health: 14+ Days Neighborhood: Tara
9.5%
(2021)
Compared to:
LA Parishes
The distribution is based on data from 64 Louisiana Parishes.
Poor Physical Health: 14+ Days Neighborhood: The Avenues/Southern University
Poor Physical Health: 14+ Days Neighborhood: The Avenues/Southern University
13.4%
(2021)
Compared to:
LA Parishes
The distribution is based on data from 64 Louisiana Parishes.
Poor Physical Health: 14+ Days Neighborhood: University Acres/Woodstone
Poor Physical Health: 14+ Days Neighborhood: University Acres/Woodstone
8.9%
(2021)
Compared to:
LA Parishes
The distribution is based on data from 64 Louisiana Parishes.
Poor Physical Health: 14+ Days Neighborhood: Valley Park
Poor Physical Health: 14+ Days Neighborhood: Valley Park
15.0%
(2021)
Compared to:
LA Parishes
The distribution is based on data from 64 Louisiana Parishes.
Poor Physical Health: 14+ Days Neighborhood: Victoria Farms
Poor Physical Health: 14+ Days Neighborhood: Victoria Farms
14.1%
(2021)
Compared to:
LA Parishes
The distribution is based on data from 64 Louisiana Parishes.
Poor Physical Health: 14+ Days Neighborhood: Westminster/Pine Park
Poor Physical Health: 14+ Days Neighborhood: Westminster/Pine Park
8.9%
(2021)
Compared to:
LA Parishes
The distribution is based on data from 64 Louisiana Parishes.
Poor Physical Health: 14+ Days Neighborhood: Zachary
Poor Physical Health: 14+ Days Neighborhood: Zachary
10.7%
(2021)
Compared to:
LA Parishes
The distribution is based on data from 64 Louisiana Parishes.
Frequent Physical Distress Parish: East Baton Rouge
Frequent Physical Distress Parish: East Baton Rouge
12.9%
(2019)
Compared to:
LA Parishes
The distribution is based on data from 64 Louisiana Parishes.
Economy / Food Insecurity
Child Food Insecurity Rate Parish: East Baton Rouge
Child Food Insecurity Rate Parish: East Baton Rouge
20.9%
(2021)
Compared to:
LA Parishes
The distribution is based on data from 64 Louisiana Parishes.
Food Insecurity Rate Parish: East Baton Rouge
Food Insecurity Rate Parish: East Baton Rouge
11.5%
(2021)
Compared to:
LA Parishes
The distribution is based on data from 64 Louisiana Parishes.
Students Eligible for the Free Lunch Program Parish: East Baton Rouge
Students Eligible for the Free Lunch Program Parish: East Baton Rouge
62.5%
(2022-2023)
Compared to:
LA Parishes
The distribution is based on data from 64 Louisiana Parishes.
Environmental Health / Built Environment
Access to Exercise Opportunities Parish: East Baton Rouge
Access to Exercise Opportunities Parish: East Baton Rouge
96.4%
(2024)
Compared to:
LA Parishes
The distribution is based on data from 64 Louisiana Parishes.
