
Search for Indicators

Priority Indicators
The Mayor's Healthy City Initiative identifies and coordinates efforts aimed at healthy eating and an active lifestyle into a unifying community commitment to better health.
- To raise awareness within the community of the problem and the services available.
- To motivate community members to make healthy choices and to join the movement to make Baton Rouge a healthier community.
- To increase the number of visitors to health-related resources on any city web site.
- To increase media outreach through community events and Healthybr.com
- To increase awareness of HealthyBR.com and the partnering organizations.
- To increase utilization of available resources to promote healthy eating and active living in Baton Rouge.
Top four priorities for 2012-2015 identified by MedBR are obesity, HIV/AIDS, ER utilization, and mental/behavioral health. The hospitals will implement a collective collaborative plan for addressing these issues in our community.
Indicator Gauge Icon Legend
Legend Colors
Red is bad, green is good, blue is not statistically different/neutral.
Compared to Distribution
 the value is in the best half of communities.
 the value is in the 2nd worst quarter of communities.
 the value is in the worst quarter of communities.
Compared to Target
 meets target;
  does not meet target.
Compared to a Single Value
 lower than the comparison value;
 higher than the comparison value;
 not statistically different from comparison value.
Trend

 non-significant change over time;
 significant change over time;
  no change over time.
Compared to Prior Value
 higher than the previous measurement period;
 lower than the previous measurement period;
 no statistically different change from previous measurement period.
Mental Health
Mental Health
Parish: East Baton Rouge
Value
Compared to:
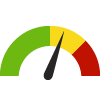
Parish: East Baton Rouge Self-Reported General Health Assessment: Poor or Fair
Parish: East Baton Rouge Self-Reported General Health Assessment: Poor or Fair
18.5%
(2021)
Compared to:


LA Parishes
The distribution is based on data from 64 Louisiana Parishes.
U.S. Counties
The distribution is based on data from 3,074 U.S. counties and county equivalents.
US Value
(16.1%)
The regional value is compared to the national value.
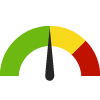
Parish: East Baton Rouge Age-Adjusted Death Rate due to Suicide
Parish: East Baton Rouge Age-Adjusted Death Rate due to Suicide
12.1
Deaths per 100,000 population
(2018-2020)
Compared to:

LA Parishes
The distribution is based on data from 27 Louisiana Parishes.
U.S. Counties
The distribution is based on data from 1,307 U.S. counties and county equivalents.
LA Value
(14.6)
The regional value is compared to the Louisiana State value.
US Value
(13.9)
The regional value is compared to the national value.
Prior Value
(13.2)
Prior Value compares a measured value with the previously measured value. Confidence intervals were taken into account in determining the direction of the comparison.
Trend
This comparison measures the indicator’s values over multiple time periods.<br>The Mann-Kendall Test for Statistical Significance is used to evaluate the trend<br>over 4 to 10 periods of measure, subject to data availability and comparability.
HP 2030 Target
(12.8)
<div>MHMD-01: Reduce the suicide rate <strong>(LEADING HEALTH INDICATOR)</strong></div>
Over-utilization of Emergency Departments
Over-utilization of Emergency Departments
Parish: East Baton Rouge
Value
Compared to:
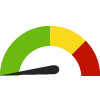
Parish: East Baton Rouge Age-Adjusted Death Rate due to Chronic Lower Respiratory Diseases
Parish: East Baton Rouge Age-Adjusted Death Rate due to Chronic Lower Respiratory Diseases
28.8
Deaths per 100,000 population
(2018-2020)
Compared to:
LA Parishes
The distribution is based on data from 55 Louisiana Parishes.
U.S. Counties
The distribution is based on data from 2,518 U.S. counties and county equivalents.
LA Value
(41.1)
The regional value is compared to the Louisiana State value.
US Value
(38.1)
The regional value is compared to the national value.
Prior Value
(31.0)
Prior Value compares a measured value with the previously measured value. Confidence intervals were taken into account in determining the direction of the comparison.
Trend
This comparison measures the indicator’s values over multiple time periods.<br>The Mann-Kendall Test for Statistical Significance is used to evaluate the trend<br>over 4 to 10 periods of measure, subject to data availability and comparability.
