
STI and HIV Goal
Engage providers and the community around ending the HIV epidemic through a community campaign while continuing to expand STI/HIV/HEP C testing and connecting people living with HIV to resources.
Intermediate Goals
Goal 1: Promote the Baton Rouge Ending the HIV Epidemic campaign.
a. Support the ongoing effort to increase awareness through the Baton Rouge Ending the HIV Epidemic Campaign.
Goal 2: Develop a tool for community members to identify what resources exist in East Baton Rouge Parish for people who are pregnant or have young children.
a. Continue to recruit organizations to add their services to the directory.
b. Develop a more community-friendly version of the resource directory.
c. Continue to promote the resource directory to increase usage.
Goal 3: Increase testing in EBRP.
a. Engage stakeholders in increasing testing, including Emergency Departments, health outreach workers, and community-based organizations. community.
What the data say:
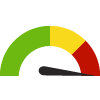
- East Baton Rouge has 987.6 incidence rate per 100,000 population for Chlamydia which is in the worst 25% compared to LA Parishes.
- East Baton Rouge has a 33.8 rate for HIV diagnosis.

STI and HIV Indicators
Use the dropdown menu to see indicators related to STI and HIV!
571.4 cases/ 100,000 population


This indicator shows the gonorrhea incidence rate in cases per 100,000 population.
Data Source: National Center for HIV/AIDS, Viral Hepatitis, STD, and TB Prevention
